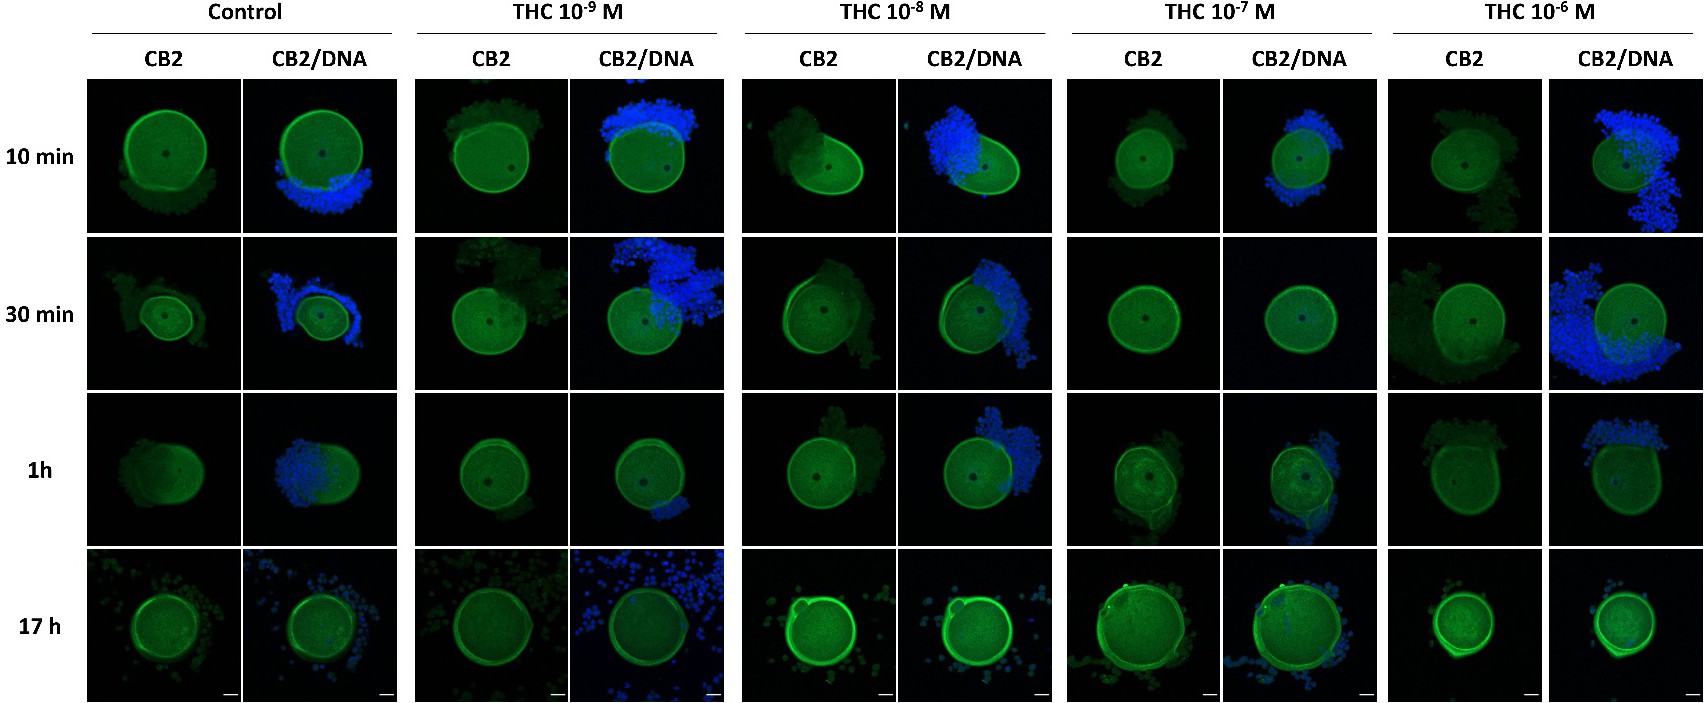
Fig. 2. Immunolocalization of CB2 during the maturation of mouse oocytes. Immature COCs were cultured in vitro in absence of THC and in presence of THC at 1 nM (10-9 M), 10 nM (10-8 M), 100 nM (10-7 M) and 1 µM (10-6 M) during 10 min, 30 min, 1h and 17 h. The distribution of CB1 is shown in green. Hoechst-labelled DNA is shown in blue. n = 5 independent experiments of 15 oocytes per treatment. All of analysed oocytes had same staining pattern; representative photomicrographs are shown. Scale bars, 20 µm.